March 21, 2024 8 min read

Reliability and Maintenance – the 3 KPIs Every Facility Should Be Tracking
Industry:
Solution:
Implementing an effective maintenance program in industrial settings can be challenging, particularly when measuring maintenance performance and setting goals. Reliability and Maintenance programs can produce a lot of data. With so much data available, it’s challenging to pinpoint the most important key performance indicators (KPIs) that will return the most value for your organization.
By tracking the following three reliability and maintenance metrics and comparing your performance against the benchmarks that world-class industry leaders have set, you can make data-driven decisions to shift maintenance tasks and operations in the right direction, slash downtime, and increase the availability and performance of your assets.
Reliability and Maintenance KPI #1: Overall Equipment Effectiveness (OEE)
The first reliability and maintenance KPI we’ll explore is OEE. This metric is the gold standard that maintenance managers use to assess how well equipment is performing based on three factors: its availability, performance, and quality.
Availability = Runtime / Planned Production Time
Availability
Availability is the amount of time that a piece of equipment is available to perform its function. This is sometimes also referred to as uptime. Availability or uptime accounts for all events that stop planned production long enough (typically for several minutes) that it makes sense to document a reason for production being down.
Runtime is the amount of time that production is up and running. You can calculate runtime by subtracting Stop Time from Planned Production Time. Stop Time is the total of all time in which a manufacturing process was scheduled to be running but was not due to unplanned stops (e.g., breakdowns) or planned stops that can result from changeover time, cleaning, planned maintenance work or inspections, or rest breaks, for example.
Dividing Runtime by Planned Production Time results in the percentage of time that equipment is available for use. We’ve provided an example for you in the chart below.
| Availability | 75% |
| Runtime (hours) | 30 |
| Planned Production Time (hours) | 40 |
Performance
The next component of OEE is Performance, which measures how long it takes equipment to complete a process or cycle. You can determine a piece of equipment’s performance by comparing its current production against projected levels.
Losses in performance occur when an operational machine produces at a suboptimal rate. This can be due to certain settings being used or employee error.
For example, equipment’s performance can suffer when workers can’t keep up with loading or unloading a machine in the projected timeframe, or when employees aren’t yet completely comfortable with or properly trained how to use a new machine or system.
To calculate equipment’s performance, you start by multiplying an equipment’s ideal cycle time (in other words, the fastest time that equipment can complete a process under optimal circumstances) by the total count of acceptable pieces the equipment produces, then divide that by the equipment’s runtime.
Performance = (Ideal Cycle Time X Total Count) / Runtime
| Performance | 90% |
| Total Count of Acceptable Pieces Produced | 950 |
| Ideal Cycle Time (hours) | 35 |
| Runtime (hours) | 30 |
Quality
Finally, quality is used to measure the number of units or pieces produced with acceptable quality.
Quality issues occur when defective products are produced or come out requiring additional work before they can be shipped. To calculate the percentage of products created by equipment with acceptable quality, you simply divide the number of acceptable pieces produced by the total number of all pieces produced.
Quality = Acceptable Pieces / Total Pieces
| Quality | 95% |
| Acceptable Pieces | 950 |
| Total Pieces | 1000 |
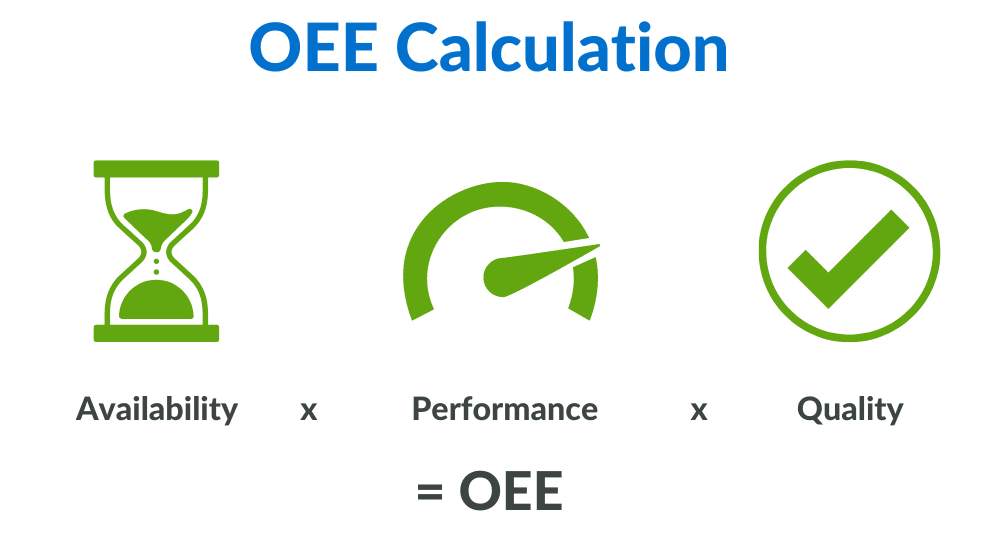
Calculating OEE
Once you’ve calculated values for Availability, Performance, and Quality, you can multiply these figures together to get your OEE score.
OEE = Availability X Performance X Quality
Need help with your OEE? We offer online training that can inform workers on the purpose of this metric, how to calculate it, and describe tips and methodologies for improving OEE scores.
To make tracking and evaluating OEE even easier, you can also download and use our free OEE calculator.
OEE Calculator
Download our OEE calculator to make tracking and evaluating OEE even easier
Get Started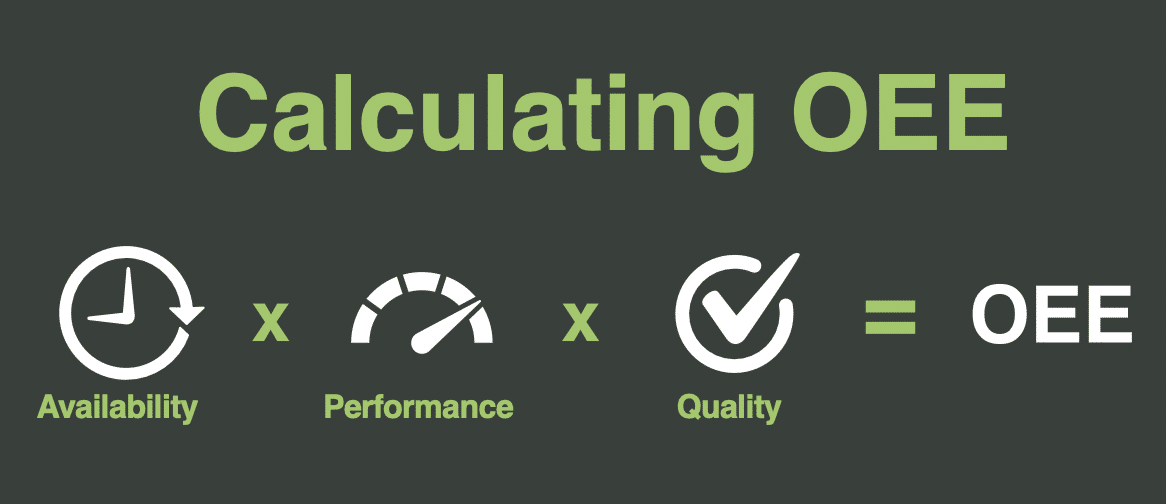
Benchmarking OEE
Having an OEE of 100 percent means zero defective products, zero breakdowns, and a manufacturing process that’s as swift as possible. But obviously, that’s much easier said than done.
According to Plant Engineering Magazine, world-class companies have an OEE of about 85 percent, while average companies typically achieve an OEE ranging between 40 to 60 percent.
The good news is that once you calculate availability, performance, and quality, you’ll get a clearer picture of which of those three components are underperforming so you can make improvements.

Reliability & Maintenance KPI #2: Mean Time Between Failures (MTBF)
Mean Time Between Failures (MTBF) is a KPI, measured in hours, that tracks the amount of time that passes between failures of a piece of machinery during normal operating hours. In other words, MTBF measures how long a piece of equipment operates without interruption.
Monitoring this KPI helps organizations optimize preventive maintenance schedules and plans to reduce unplanned downtime wherever possible.
To calculate this metric, simply start by identifying the total number of operational hours for a specific asset over a defined period. Then, divide that by the number of failures that happened during that period.
MTBF = Total Operational Time / Total Number of Failures
Improving MBTF
A high MTBF score generally means you can expect fewer problems to occur with your equipment over its lifetime, while a lower score can mean more frequent failures and expenses. A well-thought-out preventive maintenance and training plan can greatly improve your MTBF. Our partners at the University of Tennessee’s Reliability and Maintenance Center agree that anytime you can be proactive instead of reactive when it comes to maintenance, it gives you a chance to stop equipment failures before they happen.
A lack of or inadequate reliability and maintenance training, as well as poorly organized maintenance inspection checklists can all lead quickly to breakdowns.
Reliability and Maintenance KPI #3: Percent of Reactive Maintenance
Reactive maintenance is the world’s oldest approach to maintenance. It refers to any maintenance work that is performed after equipment has broken down. A 2020 international study conducted by Plant Engineering Magazine found that 60 percent of manufacturers surveyed still use reactive maintenance methods.
To calculate the percent of reactive maintenance that your organization is performing, tally up the total number of hours workers spend performing reactive maintenance tasks and divide it by the total number of hours spent on all maintenance work performed. Then simply multiply that number by 100 to give you the final percentage.
Percent of Reactive Maintenance = (Reactive Maintenance Hours/Total Maintenance Hours) X 100
Benchmarking Reactive Maintenance
Dr. Klaus Blache at the University of Tennessee’s Reliability and Maintainability Center suggests that only 5 to 15 percent of maintenance should be reactive.
There are many advantages to using proactive reliability and maintenance strategies, but overall, it’s generally much more expensive for organizations to operate with a highly reactive rather than preventive maintenance program.
For example, costs for emergency repairs can range between three to ten times higher than those for planned maintenance repairs. There are also inevitable and expensive production losses related to reactive maintenance activities since this type of work is performed after equipment is down. These losses can be five to twenty times more expensive than the cost of performing maintenance proactively.
A study conducted by global commercial real estate services company JLL concluded that implementing proper preventive maintenance not only paid for itself, but ultimately resulted in a 545% return on investment.

Implement Preventive Reliability and Maintenance Training
Effective training for maintenance technicians plays a crucial role in developing skills and promoting preventive maintenance strategies. By empowering employees with the right education, organizations can significantly reduce maintenance-related machine downtime and improve overall equipment effectiveness (OEE) and other maintenance metrics.
Online maintenance training, enriched with dynamic 3D animations and graphics, enhances learner engagement and information retention. It enables technicians to visualize and understand concepts that may otherwise be challenging to grasp without disrupting equipment operations or production schedules.
Take a Proactive Approach to Maintenance Training with Vector Solutions
Our Learning Management System (LMS) facilitates the delivery and scaling of training to maintenance teams as needed. Managers can easily track technicians’ training progress and compliance with maintenance performance metrics, providing insights into the impact of learning and development initiatives on organizational goals.
A well-trained maintenance team sets the stage for smoother operations, reduces unplanned downtime, and ultimately leads to higher customer satisfaction.
Vector Solutions has partnered with thousands of organizations that have used our online maintenance training courses and LMS developed specifically for industrial organizations to mitigate risks, retain employees, and drive uptime.
Contact us today to learn more.
A Learning Path for New and Current FM Employees
Take the guesswork out of designing your training program by providing pre-selected courses from Vector’s extensive training catalog, Facilities Management, and Maintenance Library
Download Template