February 5, 2020 14 min read
Tracking Lagging and Leading Indicators for Safety
Industry:
Solution:
All organizations set benchmarks to track their progress in reaching their business goals. Measuring the performance of your safety program should be no different.
So, how can EHS managers gauge your company’s safety performance? Start by carefully considering your safety objectives. What problems are you looking to solve? What areas of your safety program need improvement?
Answering these questions will help you to identify the right safety metrics to track. These indicators reveal important insights into the overall health of your safety management system.
No time to read? Download our guide to the top safety metrics you should be tracking.
Safety KPI Guide
With so much data available, where do you start? Learn which key performance indicators you should track to monitor your safety program.
Download
What is a lagging indicator?
Lagging indicators are key performance indicators (KPIs) that look at past statistics – data that has already occurred. By definition, they’re reactive. They can be used to track how many incidents took place at your organization, and how severe the injuries or illnesses were.
Lagging indicators are often the first metrics that safety professionals learn to use. They’re the KPIs that most management and leadership teams are familiar with. If an organization is just starting to monitor and act on safety data, they might even be the only indicators that an organization tracks.

What are some examples of lagging indicators?
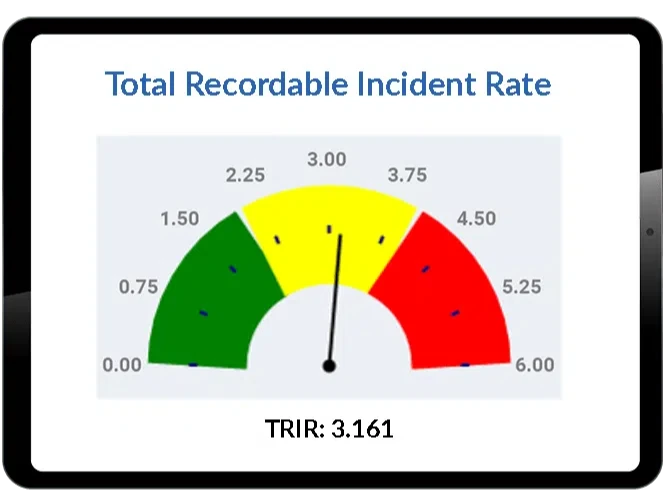
The number or location of OSHA recordable incidents; incident rates, including Total Recordable Incident Rate (TRIR), Days Away, Restricted, or Transferred (DART) Rate, and Lost Time Incident Rates (LTIR); are all examples of lagging indicators.
While it’s necessary to track lagging indicators, unfortunately, they provide little direction or insight into the behaviors and conditions that precede incidents. That’s why they should not be the only metrics that you examine. Lagging indicators are most useful when they are reviewed together with leading indicators.
Numerous organizations throughout North America rely on Vector EHS Management Software to calculate and track leading and lagging indicators.
Our best of breed of indicators, including TRIR, DART, and LTIR rates, will save you valuable time and effort in monitoring safety performance metrics. Learn how we can help.

What is a leading indicator?
Unlike lagging indicators, leading indicators are predictive metrics that focus on continuous improvement.
According to Jonathan Thomas, director of safety management solutions for the National Safety Council (NSC), leading indicators measure safety events or behaviors that occur before an incident.
In a white paper produced by NSC’s Campbell Institute, safety experts agreed that leading indicators can be defined as:
“Preventative measures that monitor and provide current information about the effective performance, activities, and processes of an EHS management system ….”
These metrics can give safety professionals advanced warning of potential problems so that preventive steps can be taken.
Leading indicators should:
- Measure the positive: what people are doing versus failing to do.
- Improve or influence constructive problem-solving.
- Allow for continuous improvement.
- Provide information that can be quickly acted upon.
After all, being proactive, preventive and predictive is only beneficial if you’re setting achievable goals.
Leading indicators can be broadly sorted into the following categories:
- Operations-based leading indicators: Metrics that reveal how well an organization’s infrastructure (e.g. machinery, operations) is functioning. For large organizations with multiple locations, these indicators can be site-specific.
- Systems-based leading indicators: These indicators relate more to the management of an EHS system. Systems-based indicators can be rolled up from a facility level to a region/business unit or corporate level.
- Behavior-based leading indicators: Indicators that measure the safety behaviors or actions of individuals or groups in the workplace. Behavior-based leading indicators can be reviewed at site-specific levels through management levels.

What are some examples of leading indicators?
The root causes of near misses, the percent of inspections or behavior based safety observations completed at a location, and training attendance and pass rates are all examples of leading indicators. By analyzing these metrics, you can get an idea of what is working, and what might be in danger of causing an incident.
Say you notice a particular location has a lower number of safe behaviors than everywhere else. Then you notice that same location has a lower training pass rate. Using these two leading indicators, you discover this location hasn’t been taking its training program seriously. These leading indicators gave you the information you needed to intervene, and possibly prevent a workplace injury.
Start tracking the right safety metrics for your organization
When you’re ready to target and monitor your safety indicators, we’ve put together the following checklist to help you get started.
1 – Identify the top problem areas of your safety program. Start with the hazards that have the greatest risk of harming workers. These should be severe hazards with the greatest likeliness of occurrence. If you’re just getting started with hazard assessments, we’ve got a helpful article on how to evaluate them using a risk matrix. Worth a read! Example: After reviewing last year’s injury records, you noticed that 22 workers were injured from trips and falls in the past year. Due to the frequency of injuries caused by tripping hazards, you decide this might be a good hazard to start with.
2 – Set a goal. Make an informed decision on what your goal should be and how long it might take to achieve. Example: After discussing it with your workers, you learned that most of the trips and falls were caused by floors cluttered with tools and equipment. You decide that a good first step to address this hazard might be to inspect and clear assembly line floors daily. You believe that if these inspections are conducted on schedule, you could reduce incidents resulting from slips, trips, and falls by 90% this quarter.
3 – Choose your leading and lagging indicators to track. Choose metrics that can help you to achieve your goal over time. Example: The number of trips and falls is a lagging indicator that you hope to drive down with a leading indicator, such as the number of inspections completed on schedule.
4 – Start gathering data. Begin collecting the leading indicator data for the time period you decided on as well as the data for your goal during that same time period. Example: Every week, review your checklists to make sure you have inspected all daily items. If inspections are being missed on any given day, find out why and try to address the issue.
5 – Periodically assess (and adjust!) your indicators and goals over time.
Assemble the results into a graph to determine whether there is a positive relationship between your leading indicator and your goal. Communicate your progress with workers. Did the actions that you took help you to achieve your goal? If not, think about how you can get on track. OSHA recommends that you customize the type and number of indicators to your needs, resources, and abilities as they evolve over time. Example: If you’ve achieved your goal, you can decide whether to continue tracking the daily cleanups after they have become routine (or consider decreasing the tracking frequency from daily to weekly). Then begin to develop and track a leading indicator for a different hazard.
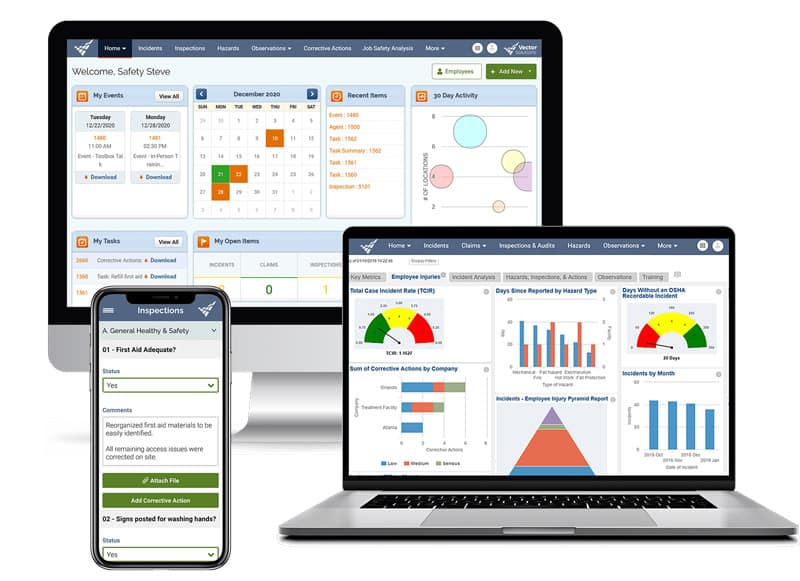
How can EHS management software help?
EHS management software significantly streamlines the collection and analysis of safety data. Data from ALL safety activities — such as incidents, inspections, behavior based safety observations, training, reported hazards, and more — can be recorded using standardized forms and stored in a single, centralized location. This enables you to report on uniform data elements and develop common safety metrics for your entire organization.
In addition, many safety dashboard software will come with a series of pre-canned, best of breed indicators to save you valuable time and effort in monitoring your metrics. Vector EHS’s default charts and graphs include TRIR, DART, and LTIR rates; percentages of inspections, training, and corrective actions completed on time; percentage of hazards resolved; and much more.
The right safety management software will also allow you to create your own custom charts and graphs, so you can track the metrics that are most important to your unique safety needs.
To learn more about how safety software can help you with your data analyses and benchmarking, contact Vector Solutions today.
Safety Metrics Dashboard
Our safety metrics dashboard makes it easy to summarize key performance indicators (KPIs) of safety to help you make informed business decisions.
Learn More