A training management system tailored for the fire service—track all training, EMS recerts, skill evaluations, ISO, and more for 100% of training in one place.
A training management system tailored for EMS services—EMS online courses for recerts, mobile-enabled skill evaluations, and more for 100% of training in one place.
Increase performance, reduce risk, and ensure compliance with a training management system tailored for your FTO/PTO and in-service training for 100% of training in one place.
Integrated solution purpose-built for modern regulatory demands. ArdentSky, delivers automated, integrated compliance solutions trusted by global gaming manufacturers, operators, and suppliers.
What Is TRIR (TCIR)? Definition, Calculation, and Benchmarks
Contents
Blog
July 6, 2026 5 min read
Share:
What Is TRIR (TCIR)? Definition, Calculation, and Benchmarks
Industry:
Commercial EnterpriseMultiple Industries
Solution:
Vector EHS Management
Share:
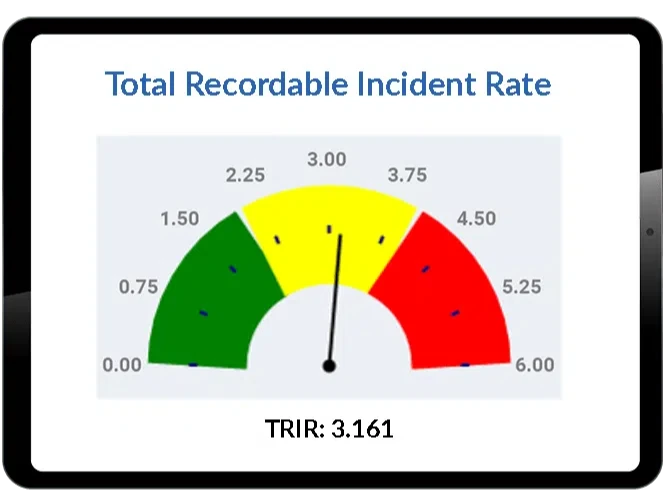
Total Recordable Incident Rate (TRIR) is a critical workplace safety metric. It’s also known as Total Case Incident Rate (TCIR), OSHA incident rate, or total injury rate. These all refer to the same measure, calculated the same way and used interchangeably.
You can calculate your TCIR or TRIR by using the following formula:
(Number of OSHA recordable injuries and illnesses × 200,000) ÷ Employee total hours worked = TCIR or TRIR
This 200,000 represents 100 employees working 40 hours a week for 50 weeks during a calendar year. Then, this number is divided by the total number of hours a company’s employees worked.
Here’s an example of the formula in practice. A facility logs 3 recordable incidents over a year with 450,000 hours worked: (3 × 200,000) ÷ 450,000 = 1.33 TRIR.
Hours worked totals must be accurate for this equation. Count hours for salaried, hourly, part-time, and temporary workers you supervise. Exclude vacation, sick leave, and holidays.
For example, a company has recordable incidents that occurred during the year. If the organization has around 1,000 employees that work 40 hours a week, this number may not be consequential or indicative of a greater problem. If it employs 15 people, and reports the same number of recordable incidents, OSHA may be concerned. It appears that the company is failing to follow proper healthy and safety procedures.
OSHA also considers industry risk levels when examining TCIR/TRIR rates. For example, a logging company or a heavy manufacturer with a high incident rate might have this due to a dangerous working environment. If a high rate comes from a low-risk retailer or manufacturer, it may mean the organization needs to take action to fix this issue.
An incident belongs on your Form 300, and in your TRIR, when it meets any of these criteria under OSHA 29 CFR 1904.7:
Death
Days away from work
Restricted work or job transfer
Medical treatment beyond first aid
Loss of consciousness
Two gray areas trip up even seasoned recordkeepers. A pre-existing condition becomes recordable when work makes it worse and the flare-up triggers one of the criteria above. Telecommuting injuries are recordable only when tied directly to work tasks, not the general home setting.
What is a DART Rate?
A Days Away Restricted or Transferred (DART) Rate includes only OSHA recordable injuries or illnesses that result in days away from work, restricted duty, or transfer of duties. The DART rate is calculated using the following formula:
(Number of OSHA recordable injuries and illnesses that resulted in days away, restricted duty, or transfer of duty × 200,000) ÷ Employee hours worked = DART Rate
In most cases, your DART will be lower than your TCIR. This is because it includes only the severe OSHA recordable injuries and illnesses.
How TRIR compares to DART, LTIR, and EMR
Stakeholders, insurers, and general contractors don’t judge a safety program on TRIR alone. Each metric below captures a different slice of your results.
Metric
What it measures
Formula
Primary use
TRIR
All OSHA recordable cases
(Recordables × 200,000) ÷ hours worked
Overall safety benchmarking
DART
Cases with days away, restriction, or transfer
(DART cases × 200,000) ÷ hours worked
OSHA SST targeting; severity
LTIR
Cases with days away from work only
(DAFW cases × 200,000) ÷ hours worked
Severity; construction prequalification
EMR
Workers’ comp claim experience vs. peers
Set by NCCI / state bureau on 3-year claims
Insurance pricing; prequalification
OSHA’s Site-Specific Targeting program selects establishments for inspection based on elevated or rising DART rates from Form 300A submissions, not TRIR. Your DART trend is what drives inspection risk.
Manage TRIR and DART from one system
Capture incidents, near-misses, and hazards, then report TRIR and DART from a single source of truth, without manual spreadsheet consolidation.
Incident rates are a benchmark. You can use them to compare your company’s safety program with others or to assess your past performance. It’s a good idea to keep an eye on these metrics as they play a key role in improving safety performance.
Incident rates vary by industry, so the type of industry and the nature of the work are considered when analyzing past data. Incident rates are lagging indicators. According to OSHA, these statistics do not reliably indicate future incidents or procedures. For similar industries, OSHA may compare certain safety data of companies to others within the same business sector.
Why the Total Incident Rate matters
The Total Incident Rate is a key measure for assessing workplace safety over time and across different industries. It helps organizations spot patterns, tackle potential risks, and assess how well their safety programs are working. This metric plays a major role in OSHA compliance, insurance assessments, and internal safety reviews. A lower TCIR often indicates strong safety protocols and reduced workplace risk. By tracking and improving this rate, organizations can maintain compliance. This also helps create a safer and more productive work environment.
“Incident rates are used throughout many industries. Although OSHA could potentially use this data for enforcement action, unless incident rates are consistently high for a small company over a number of years, they will not normally target particular industries or companies for enforcement action.”
New Mexico Mutual
provider of medical benefits for injured workers, explained in a report
The stakes go beyond compliance. The average cost of a medically treated work injury reached $48,000 in 2024. Total US work-injury costs hit $181.4 billion, according to NSC Injury Facts.
Each recordable also raises your EMR at the next update, lifting workers’ comp premiums for three years. Buyers build these numbers into bid and prequalification requirements, with a common standard being an EMR at or below 1.0 and a TRIR below the industry average. These are surfaced through platforms like ISNetworld and Avetta during contractor vetting. And because OSHA now publishes case-level data from larger high-hazard sites, your incident details are visible to customers, primes, and insurers.
What is a good TCIR / TRIR?
Total recordable rates vary widely by industry, so the most useful benchmark is your own. Most organizations compare themselves against other employers with the same NAICS code rather than a national figure.
Across all private industry, the total recordable case (TRC) rate (BLS’ term for TRIR) was 2.3 cases per 100 full-time workers in 2024, according to the BLS Survey of Occupational Injuries and Illnesses. That national average hides large gaps between sectors, so treat it as context, not a target.
Health care and social assistance declined to 3.4 in 2024.
To judge whether your own rate is strong or concerning, don’t rely on a generic band. Pull the first-quartile, median, and third-quartile values for your specific NAICS code and establishment size. Use BLS’s incidence rate calculator and comparison tool, then compare. A rate at or below your industry’s first quartile means you outperform roughly three-quarters of comparable employers. A rate near the third quartile means most peers do better than you.
For example, BLS data for construction machinery manufacturers with 50–249 employees puts the first quartile at 1.9 and the third quartile at 11.3.
How to lower your TRIR
TRIR records what already went wrong. It can’t tell you whether your program is preventing the next incident. Pair it with leading indicators that measure prevention activity. These include:
Near-miss reporting rates, where rising volume signals trust in the system, not worsening conditions
Behavior-based safety observation completion rates, which show whether supervisors are coaching
Hazard closure rates, the share of identified hazards corrected within your target window
Lowering TRIR takes specific, measurable steps:
Set a near-miss reporting target.
Push inspection completion above 95%.
Track corrective-action closure time.
Audit recordability decisions monthly to prevent both over- and under-recording.
How safety software improves incident rate reporting
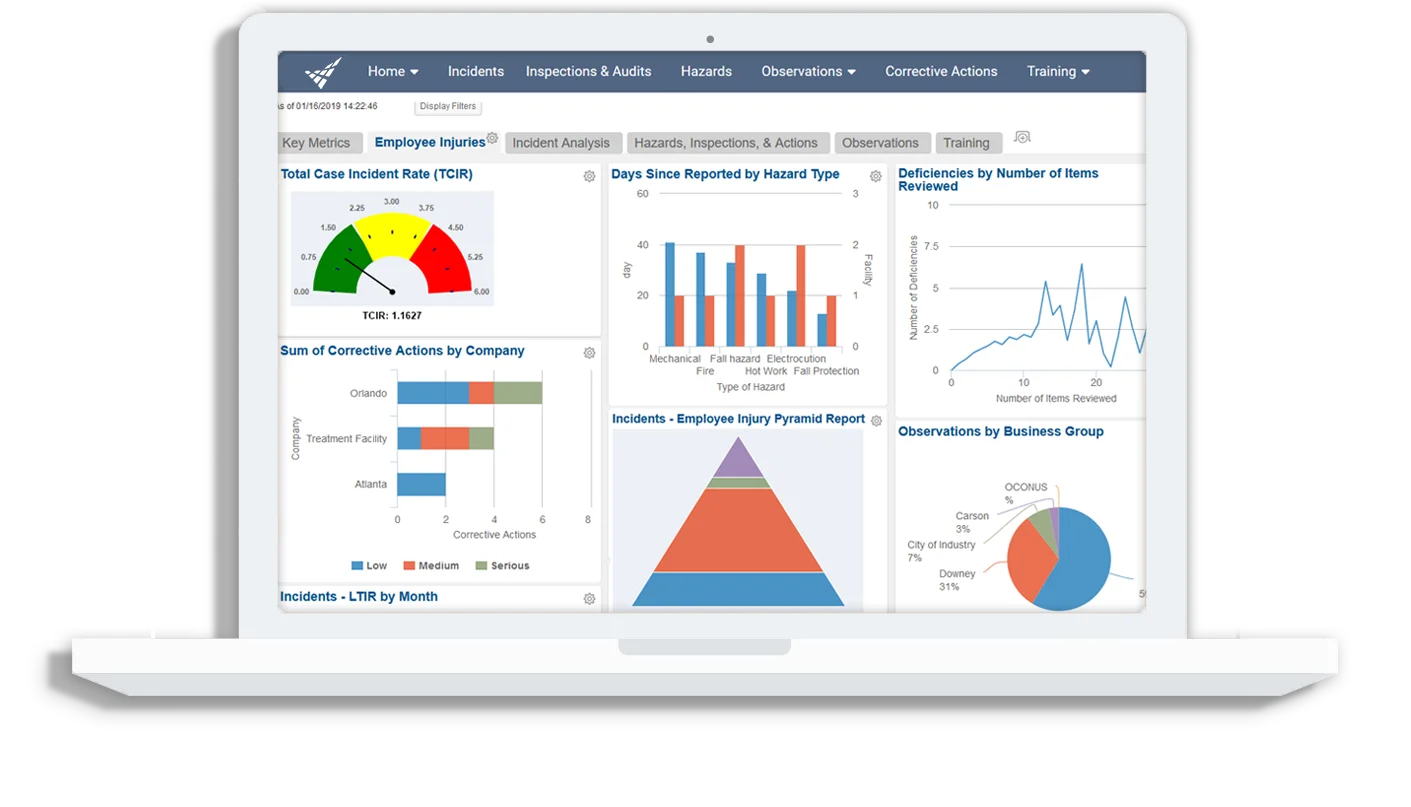
Vector EHS’s Incidents Module helps companies gather essential incident-related data and then analyze it for trends or problems. Any range of incident, injury or illness can be tracked through this software, allowing your users to generate reliable OSHA 300, 300A and 301 logs to keep in compliance with OSHA recordkeeping regulations.
See Your TRIR Calculated Automatically
Bring incidents, hours, and recordability decisions into one system and watch your rates update in real time. Walk through it with our team.
Calculate TRIR at least quarterly to track trends and catch spikes early. Annual math meets Form 300A reporting needs but gives you little program feedback. Monthly or quarterly rates let you connect changes to training, staffing, or process updates.
Can my TRIR ever be zero?
Yes. A zero TRIR means zero OSHA-recordable incidents during the period. It is plausible for small operations or short windows, but uncommon to sustain across 500+ workers over a full year, and a zero rate well below your industry average is worth checking for under-recording.
Do I include contractor hours in my TRIR calculation?
Include hours for contractors you supervise daily on your worksite, which usually covers staffing-agency temps. Exclude hours for contractors who work under their own supervision, even if they’re on your property.
What’s the difference between TRIR and EMR for insurance purposes?
TRIR measures your recordable-incident rate per 100 workers each year. EMR compares your workers’ comp claim costs to similar employers over three years and directly adjusts your premium. A high TRIR signals frequency; a high EMR signals frequency and severity. Improving TRIR this year won’t change your current EMR, but sustained gains lower it at the next update.