Track Safety Metrics and Indicators
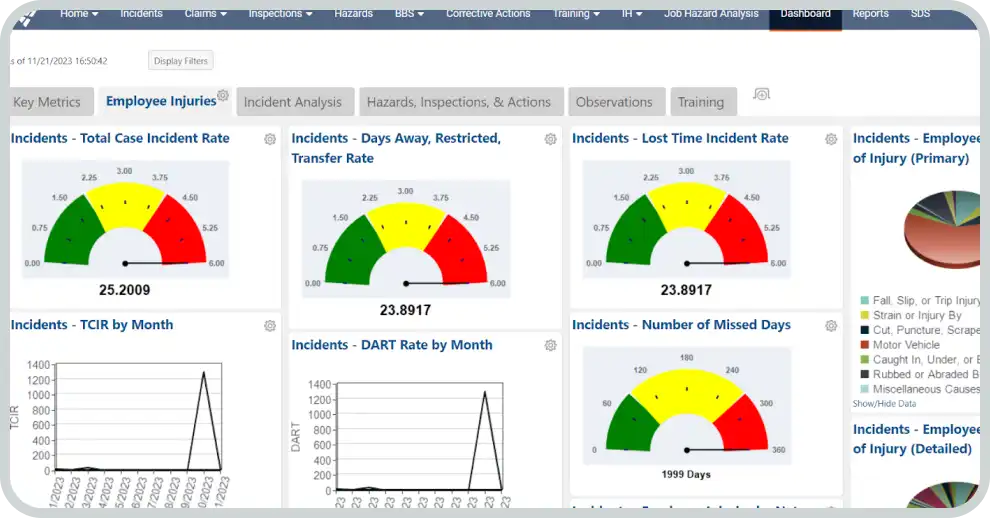
Monitor leading and lagging indicators and compare key metrics over time to improve safety.
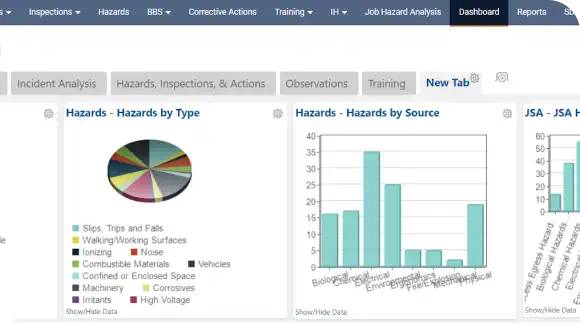
Leverage customizable safety dashboards and reports with real-time data metrics to deliver valuable insights to improve workforce safety programs.
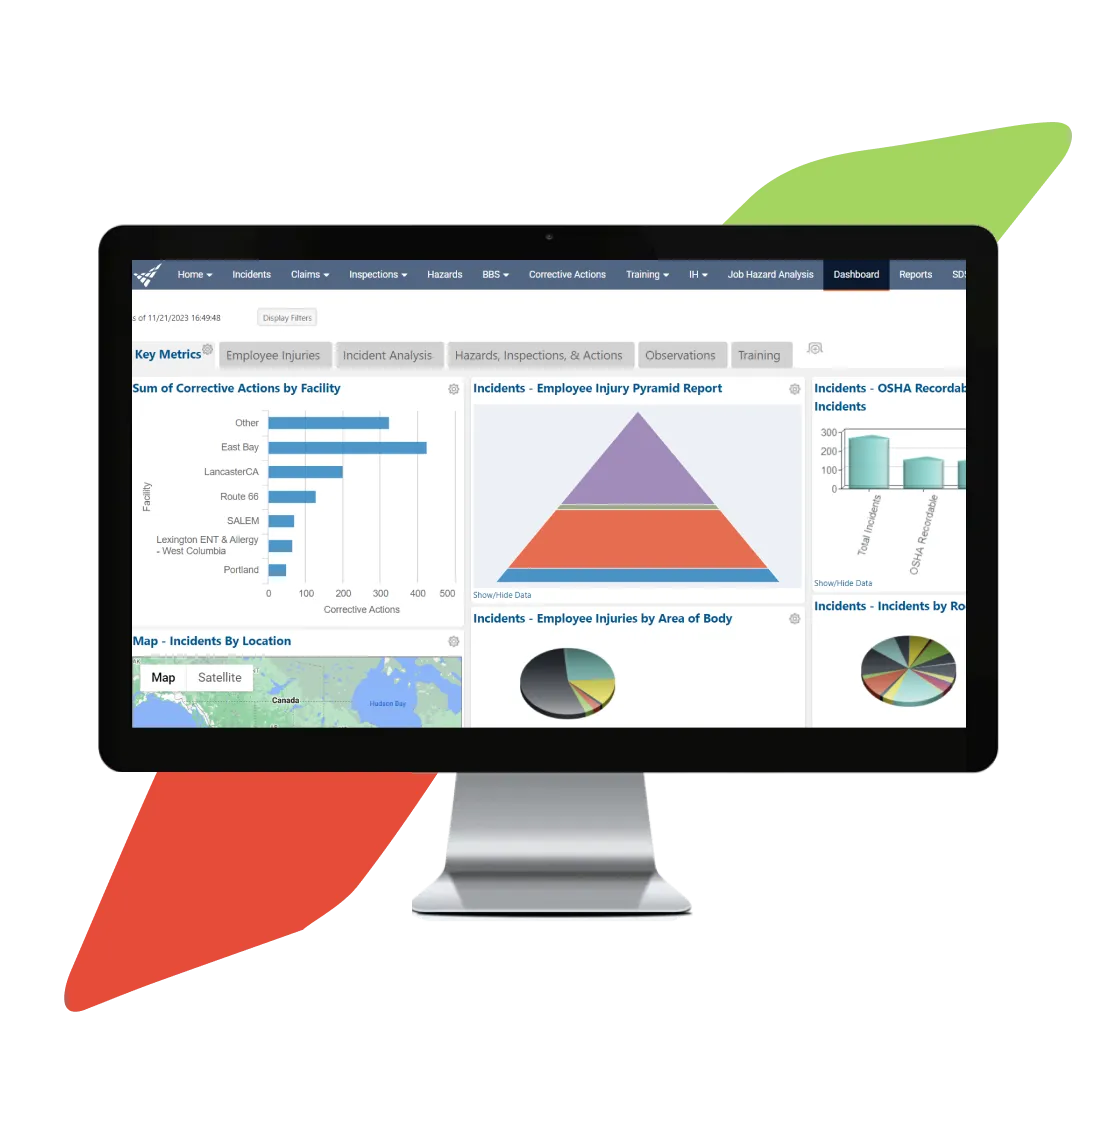
Determine the effectiveness of your EHS program using key metrics to identify improvements, track progress, and support compliance readiness.
Monitor leading and lagging indicators and compare key metrics over time to improve safety.
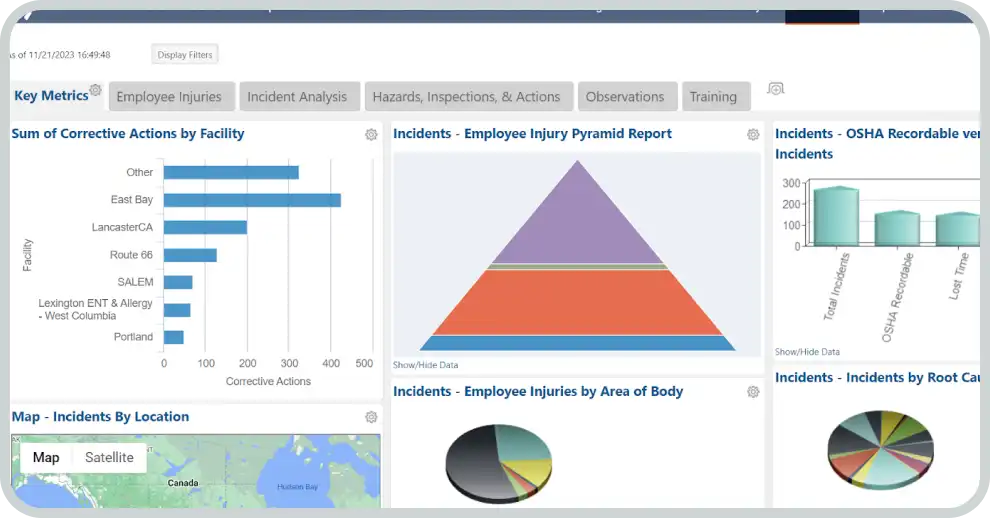
Build customized dashboards or access pre-built charts and indicators.
View safety KPI metrics and analysis reports to empower informed decision-making and implement preventive measures.
Track safety metrics and compare over time to see where your program is successful, where improvements are needed, and how efforts support compliance.
Closely monitor health and safety data with configurable, intuitive dashboards and reports to simplify tracking and reporting.
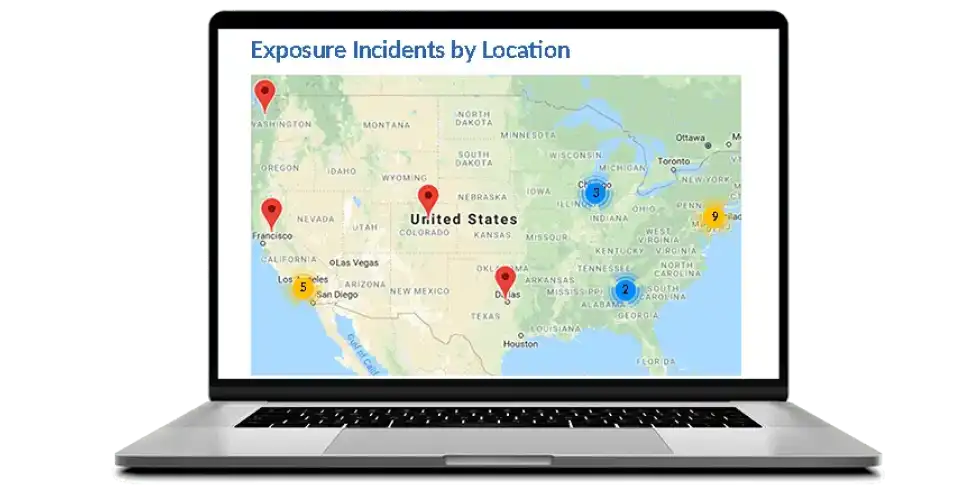
Drill down into the details of your EHS data to improve safety, support compliance, and identify preventive actions.
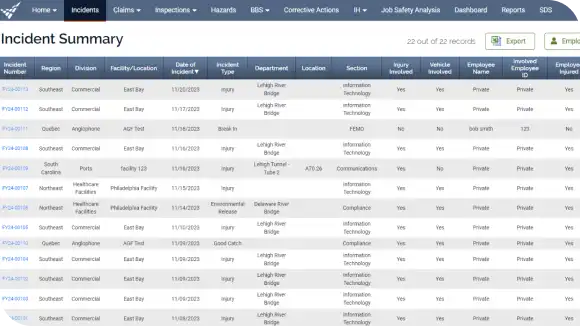
Capture clearer incident data with AI Incident Assistant, create OSHA forms, and simplify compliance.
Identify, analyze, and remediate hazardous conditions with hazard and risk software.
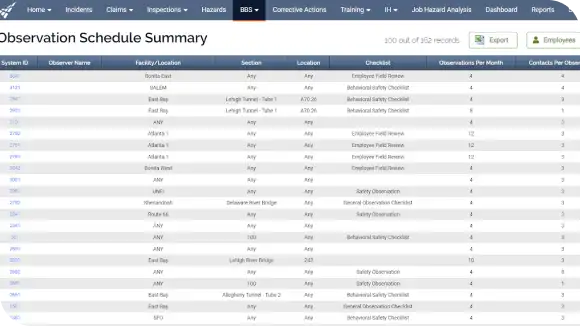
Observe behavior-based safety observations and monitor employee safety-critical behavior.
Perform safety inspections and audits and track compliance with pre-built checklists and forms.
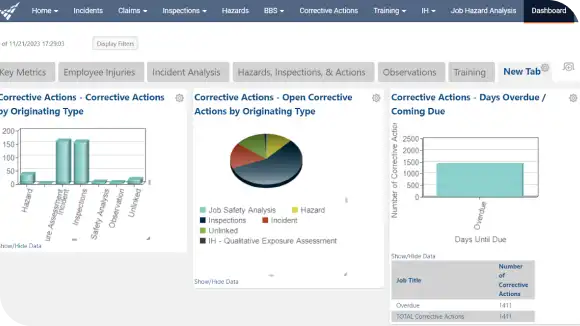
Assign corrective actions and use AI safety training recommendations to close gaps faster.

Explore our suite of integrated EHS software modules.
Explore our suite of integrated EHS software modules.
Find Out More
Manage the safety data and implement changes where needed to improve compliance and reduce exposure to EHS-related penalties.
Leverage Vector EHS, Vector LMS, and online training to connect safety, compliance, and workforce readiness to incident reduction.
Reduce time spent on manual administrative tasks and devote more attention to hands-on, strategic safety initiatives.
How to Comply with OSHA’s Requirements for Reporting and Recording Work-related I...
Download


With the help of Vector EHS we are building a framework that can assist us in identifying contributing factors, becoming more responsive, and being proactive in our safety programs.
Maintenance Planner
Idaho Forest Group
Read the customer story
A cornerstone of our world-class safety program is our investigation of all safety issues. Vector EHS’s invaluable dashboards and reports help us continuously improve safety.
HS&E Manager
Rockline Industries
Read the customer story“[Vector EHS] has components of everything that we need from training to incident management, to hazard management, to environmental inspection management, recording, and claims capabilities... I would recommend Vector Solutions for just about any company.”
Safety Project Manager
Woodgrain Inc.
Read the customer story


September 16, 2024 7 min read

September 27, 2023

January 7, 2026


Leverage online health and safety software to manage EHS data and simplify reporting.

Elevate safety in the workplace with best-in-class safety training courses.

Store, organize, and access safety data sheets (SDS) and chemical inventory online.

Improve performance and support compliance with industry-specific learning management.