A training management system tailored for the fire service—track all training, EMS recerts, skill evaluations, ISO, and more for 100% of training in one place.
A training management system tailored for EMS services—EMS online courses for recerts, mobile-enabled skill evaluations, and more for 100% of training in one place.
Increase performance, reduce risk, and ensure compliance with a training management system tailored for your FTO/PTO and in-service training for 100% of training in one place.
Integrated solution purpose-built for modern regulatory demands. ArdentSky, delivers automated, integrated compliance solutions trusted by global gaming manufacturers, operators, and suppliers.
You have built a risk matrix. Your team scores hazards, plots them on a grid, and color-codes the results. But when the next incident happened, the matrix did not stop it. You wonder whether the tool works or just records what you already knew.
The question is not whether to use a risk matrix. It is whether your scoring system connects to anything that prevents the next injury. A matrix works when every score ties to a quantitative threshold your whole team understands. Every Serious or High rating should trigger a corrective action with a named owner and a documented closure. This article shows you how to build that system: one that turns risk scores into decisions that hold up during audits and drive lower incident rates.
Main takeaways
A risk matrix works only when every score ties to a quantitative threshold and triggers a corrective action with an owner.
The 5×5 format offers the detail high-hazard operations need, but only if every scorer agrees on what each number means.
Your severity scale should align with OSHA recordable and reportable thresholds, which keeps risk decisions supported during inspections.
Every Serious or High risk needs a named individual, a response strategy (avoid, transfer, mitigate, or accept), and a verified closure date.
Risk matrices fail when probability and severity lack measurable anchors, or when different hazards land in the same cell.
Build a Defensible Risk Matrix
See how severity and likelihood scales come together, where common matrices break down, and how to calibrate yours.
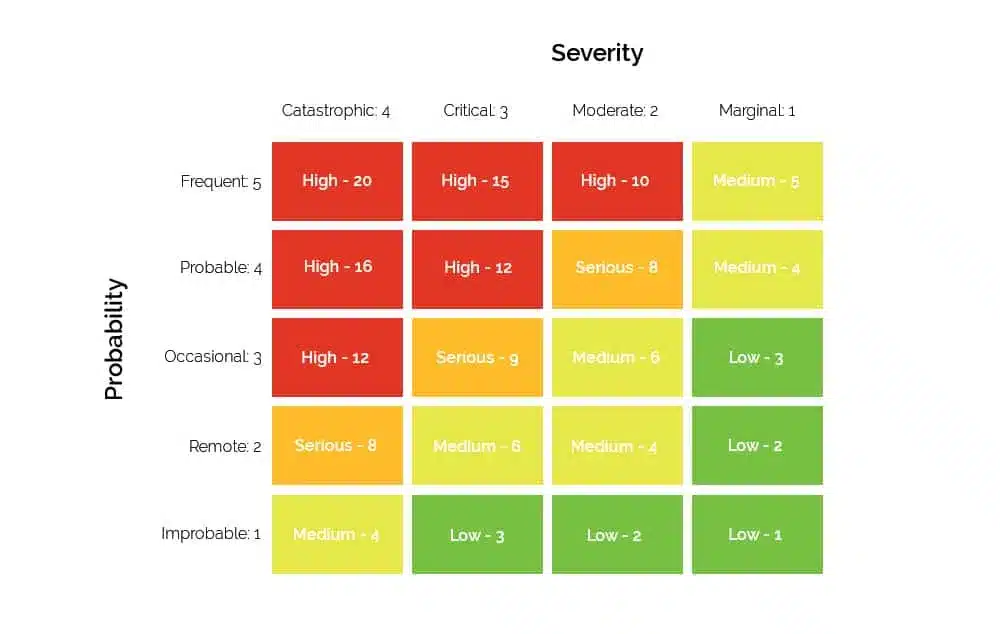
A risk matrix, sometimes called a probability and impact matrix, is a grid that ranks every hazard on two dimensions. One axis measures how likely the event is. The other measures how severe the outcome would be. The scoring formula is simple: Risk Level = Probability × Severity.
On a standard 5×5 risk matrix, probability runs from Improbable (1) to Frequent (5). Severity runs from Negligible (1) to Catastrophic (5). Multiplying those two numbers produces a score between 1 and 25. That score slots into one of four color-coded action bands that tell you what to do, not just how worried to be.
Score range
Risk level
Color band
Action
1–3
Low
Green
Monitor; no immediate action required
4–9
Medium
Yellow
Plan mitigation; assign a review date
10–16
Serious
Orange
Develop an immediate action plan with an owner
17–25
High
Red
Halt the activity or mitigate before proceeding
Risk matrix types: 2×2, 3×3, 4×4, and 5×5
No single grid size works for every operation. The right format depends on how mature your EHS program is and how varied your hazard exposures are.
In high-hazard industries, the 5×5 risk matrix is the most widely used. It offers enough detail to separate a near miss from a recordable from a fatality. That resolution only holds when every scorer on your team agrees on what each number means.
Choosing the right risk matrix level
The right format depends on your organization’s needs, project size, and the complexity of the risks you face. A 3×3 matrix suits small projects or teams that need quick, high-level insight. A 4×4 adds balance for medium-sized operations that want more detail without unnecessary complexity. A 5×5 is common in high-risk industries where operational risks need thorough analysis to allocate resources well.
Matrix type
Best use case
Example benefit
3×3
Small projects, fewer risk events
Quick severity and likelihood overview
4×4
Medium-sized operations, project planning
Balance between detail and simplicity
5×5
High-risk industries, complex assessments
Detailed prioritization and resource allocation
Risk levels: low, medium, and high
Every risk matrix sorts hazards into levels of risk, typically low, medium, and high, shown in green, yellow, and red. Some organizations prefer a simple low/medium/high risk matrix to categorize risks quickly. It does not provide the detail of a 3×3, 4×4, or 5×5 format, but it works well for small projects or teams that need a fast way to prioritize without overcomplicating the process. As your program matures, moving to a numbered 5×5 gives each level a defined score and a clear action.
How to create a risk matrix
1. Identify hazards. Draw from JSAs, inspection findings, incident history, and near-miss reports. Start with the tasks that carry the highest exposure.
2. Define probability and severity scales with quantitative anchors. Probability: 1 = Improbable (less than once per year), 2 = Remote (about annually), 3 = Occasional (quarterly), 4 = Probable (monthly), 5 = Frequent (weekly or more). Severity: 1 = Negligible (first aid only), 2 = Marginal (medical treatment, no lost time), 3 = Moderate (OSHA recordable), 4 = Critical (OSHA reportable, hospitalization or amputation), 5 = Catastrophic (fatality or permanent disability).
3. Score each risk. Multiply probability × severity for every hazard, and record who scored it and when.
4. Plot on the matrix. Place each scored hazard in its cell and color-code it by the action bands above.
5. Assign ownership and a response strategy. Every risk rated Serious or High needs a named owner, a response strategy, and a due date.
Risk matrix and OSHA: what safety professionals need to know
OSHA does not require a specific risk matrix format. But the General Duty Clause, Section 5(a)(1), does require you to identify and address recognized hazards. Your severity scale needs to align with OSHA’s recordable and reportable incident thresholds so your risk decisions are supported when an inspector reviews them.
Severity 1–2 (Negligible / Marginal): non-recordable events, near misses and first aid. No 300 log entry, but worth capturing as leading indicators.
Severity 3 (Moderate): an OSHA recordable, including restricted work, job transfer, or medical treatment beyond first aid, which triggers a 300 log entry.
Severity 4 (Critical): an OSHA reportable event, inpatient hospitalization, amputation, or loss of an eye, with a 24-hour reporting clock.
Severity 5 (Catastrophic): a fatality, reportable within 8 hours.
The General Duty Clause creates a legal requirement to act on hazards you have recognized. If your matrix flags a risk as Serious or High and no corrective action backs it up, that gap is visible to any compliance officer on your site. As of January 2025, a single serious violation can cost up to $16,550, and willful or repeated violations up to $165,514.
Two examples show how the mapping works in practice:
Construction, fall from elevation: Probability 3 (Occasional, quarterly exposure during steel erection) × Severity 5 (Catastrophic, fatality) = 15. That is Serious/Orange. Response: fall arrest system required, named owner, 48-hour corrective-action deadline.
Utilities, electrical arc flash: Probability 2 (Remote, non-routine switchgear maintenance) × Severity 4 (Critical, hospitalization-level burns) = 8. That is Medium/Yellow. Response: arc-rated PPE verified, energized work permit required, review date set.
Stop Losing Corrective Actions to Spreadsheets
Connect hazards, incident insights, and assigned owners to a single workflow that tracks due dates and verified closure.
What to do after scoring: turning results into action
A number on a grid does not prevent an injury. A risk score only matters when it is attached to a person who owns it, a strategy for resolving it, and a corrective action tracked until someone verifies it is closed. Once you have scored your hazards, each one needs a response strategy:
Avoid: remove the hazard entirely by redesigning the process so the exposure no longer exists.
Transfer: shift the risk to a party better equipped to control it, such as a qualified subcontractor.
Mitigate: lower probability or severity through the hierarchy of controls, starting with engineering controls before administrative controls or PPE.
Accept: acknowledge a residual risk that stays low after controls, and document the decision with a scheduled review date.
Every hazard in the Serious or High range needs a named individual, not a department, who owns the corrective action. Assigning a task without tracking it to verified closure is the same as not assigning it at all.
Worked example: from initial score to residual risk
A worker lifts heavy castings from a floor-level box and carries them to a grinding wheel, 20 to 30 castings per hour. The main hazards are dropping a casting on a foot and straining the lower back from repetitive lifting.
Initial score: likelihood is Occasional (3) and severity is Critical (4), since a dropped casting could cause a fracture requiring hospitalization. 3 × 4 = 12, which lands in the Serious/Orange band.
Controls: move the box closer to the grinding wheel to cut carrying distance, and require steel-toed boots.
Residual score: severity stays Critical (4) because the potential injury is unchanged, but likelihood drops to Remote (2). 4 × 2 = 8, now Medium/Yellow. If that residual risk is still unacceptable, add a lift-assist device or redesign the task for better ergonomics, then reassess.
When the risk matrix fails: how to fix it
Research in Structural Safety found that risk matrices can rank hazards worse than random when probability and severity are negatively correlated. That does not mean you should abandon the matrix, but you need to understand where it breaks down. Two structural flaws cause the most damage:
Subjectivity: when scale levels lack quantitative definitions, two people scoring the same hazard land in different bands.
Range compression: very different hazards can land in the same cell. A 5 × 3 and a 3 × 5 both score 15, yet call for entirely different controls.
Fix both by anchoring every scale level to a measurable threshold, running calibration sessions where your team scores the same hazards and tightens definitions until they converge, and adding FMEA or bow-tie analysis for high-consequence, low-probability risks. The matrix is a triage tool, not the final assessment for your most catastrophic exposures.
Turn your risk matrix into a system that prevents incidents
A risk matrix is only as good as what happens after the score. The programs that lower incident rates are the ones where every Serious or High rating ties to a named owner, a response strategy, and a closure date someone verifies.
Vector EHS Management closes that gap. It connects risk matrix scores directly to corrective action tracking, aligns severity to OSHA’s recordable and reportable thresholds, and feeds the same data into your 300 Log, DART, and TRIR. JSAs, incident investigations, and hazard assessments all run through one calibrated matrix, keeping your scoring audit-ready instead of scattered across spreadsheets.
See It on Your Own Hazards
Bring your matrix and a live corrective-action backlog to a short walkthrough, and we'll show you where closure is slipping.
OSHA does not mandate a specific format, but the General Duty Clause requires you to address recognized hazards. Map your severity levels to OSHA’s thresholds: Moderate (3) aligns with an OSHA recordable (300 log entry), Critical (4) with reportable events like hospitalization or amputation (24-hour deadline), and Catastrophic (5) with fatalities (8-hour deadline). Documenting corrective actions for Serious or High risks shows compliance and reduces penalty exposure.
What’s the difference between a 3×3, 4×4, and 5×5 risk matrix?
A 3×3 gives a quick severity-and-likelihood overview for small projects. A 4×4 adds balance for medium-sized operations and removes the neutral center tier. A 5×5 gives high-risk, multi-site operations the detail to separate a near miss from a recordable from a fatality, at the cost of needing regular calibration to keep scoring consistent.
How do I know if my team’s risk scores are consistent enough to trust?
Run a calibration session: have your team score the same five hazards independently, then compare. If two people land in different color bands, tighten the scale definitions. Anchor every level to a quantitative threshold so “Occasional” and “Moderate” mean the same thing to every scorer, and repeat yearly or when adding new team members.
What should I do when a risk scores Serious or High but I can’t mitigate it immediately?
Document the risk, assign a named owner, and set an interim control such as PPE or a permit-to-work system. Then establish a funded mitigation timeline. Leaving a Serious or High scored risk unaddressed with no plan creates General Duty Clause exposure during an inspection. Track both the interim control and the mitigation timeline in your corrective-action system.
Can I use the same risk matrix for job safety analysis and incident investigation?
Yes, if your probability and severity scales use the same quantitative anchors. Use frequency data for probability and OSHA thresholds for severity. One matrix across JSAs, incident investigations, and hazard assessments keeps scoring consistent and auditable across all three.