


Statistical Process Control, Part 1
1.00 Hr
SKU: OTSPC10CEN
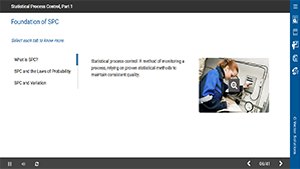
An important goal of every process plant is to produce a quality product at the lowest possible cost. In this course, you will explore how statistical process control, or SPC, can be used to help maintain consistent quality and reduce costs.
✕
Demos + Pricing
Learn more about our courses, get pricing, and see our platform.
✕
Course Details
Learning Objectives
Product Quality and the Origin of SPC
In this topic, you will learn to:
In this topic, you will learn to:
- Define quality in terms of the process industry.
- Explain what SPC is.
- Describe benefits of SPC.
- Describe how SPC was developed.
SPC Terminology and Application
In this topic, you will learn to:
- Describe what a process is.
- Identify factors that affect a process.
- Describe the two basic types of variation in a process.
- Identify factors that affect how SPC is applied to a process.
Introduction to SPC Charts
In this topic, you will learn to:
- Describe how to plot values on a basic X-Y graph.
- Explain what a histogram is and how it relates to SPC control charts.
- Explain what standard deviation is.
The Shewhart Control Chart
In this topic, you will learn to:
- Identify the basic elements of a typical Shewhart control chart.
- Relate a Shewhart control chart to a normal distribution curve.
Using SPC Control Charts, Part 1
In this topic, you will learn to:
- Describe how to plot values on an X ÍÂ… chart.
- Describe how to plot values on an R chart.
- Explain why an X ÍÂ… chart and an R chart are commonly used together.
Using SPC Control Charts, Part 2
In this topic, you will learn to:
- Describe how to plot values on a moving X ÍÂ… chart.
- Describe how to plot values on a moving R chart.
- Describe how to plot values on an individual X chart.
Specs
Course Level
Intermediate
Languages
English
Compatibility
Audio, Video